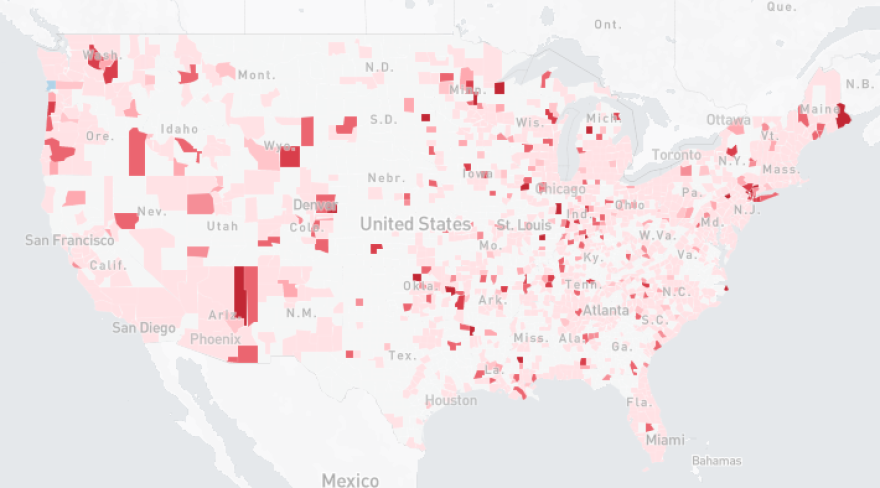
Carnegie Mellon University researchers are working on figuring out how to forecast coronavirus transmission county by county across the United States.
The university’s Delphi COVID-19 Response Team have been gathering data from a variety of sources, including Facebook, Google, a flu test manufacturer and an unnamed “national health care provider.”
Facebook went live with a map of its contribution to the project on Monday, accompanied by an op-ed in the Washington Post by founder and chief executive Mark Zuckerberg.
For the past couple of weeks, Facebook has been asking users to voluntarily participate in a survey about symptoms similar to COVID-19, such as fever, coughing and loss of sense of smell. The map shows an estimated percentage of people in each county with these symptoms; in Allegheny County, the figure is 0.68 percent. The team got about 150,000 responses each day.
Roni Rosenfeld, co-leader of the Delphi research group, which has been doing flu predictions for years, said the Facebook data is important, but it doesn’t tell the whole story.
“The reason you need so many sources is two-fold: [First], any one of these sources is not perfect. They have errors, they have fluctuations, they have noise, so you cannot rely on any one source,” Rosenfeld said. “The second one is that they look at somewhat different aspects of the beast.”
From Google, researchers will harvest data about searches related to coronavirus, which previous research on the flu has shown are strongly tied to disease prevalence, said Rosenfeld. Google is also running a symptom survey, similar to Facebook’s.
The flu test manufacturer, Quidel, will provide data about negative flu tests. People presenting with COVID-like symptoms are often tested for the flu. The health care provider will furnish data about the number of people going to the doctor with COVID-like symptoms.
Rosenfeld said they also have plans to work with the Allegheny County Health Department as well as hospitals and health systems in western Pennsylvania to publish data about daily use of hospital beds, ICU beds and ventilators.
“The hospitalization number, it’s the prime metric in flattening the curve,” said county epidemiologist LuAnn Brink last Wednesday.
All of this data taken together will allow the CMU team to create predictions about how the disease will progress in different parts of the country.
“We are particularly focused on trying to figure out what will be the demand, how many people will need ICU care, how many people will need ventilators one week, two weeks, three weeks and four weeks from now,” he said.
Rosenfeld said the aggregate data from all of these sources will be more useful than current testing data, because testing capacity is limited, and because policies for testing vary across health systems, cities, counties and states. He said he hopes policy makers will use the data to guide reopening efforts; Gov. Tom Wolf's administration said it will consider "all public, open data sets available" as it begins to reopen the commonwealth on May 8.
While CMU plans to release maps showing the Google, Quidel and health system data on Thursday, Rosenfeld said one thing is already clear.
“I do see the impact of our stay home behavior. You can see it very clearly in our own region, Southwestern Pennsylvania. It has been working.”
WESA receives funding from Carnegie Mellon University.


